
Compare every site the same way.
Score a whole shortlist on the same data and rank it like for like, with the numbers behind every score.
What investment teams use it for
A like-for-like view of every opportunity.
One dashboard across the portfolio
Every site, its stage and its headline figures in one place. GDV, cost and profit sit side by side for the whole portfolio.
Overview and pipeline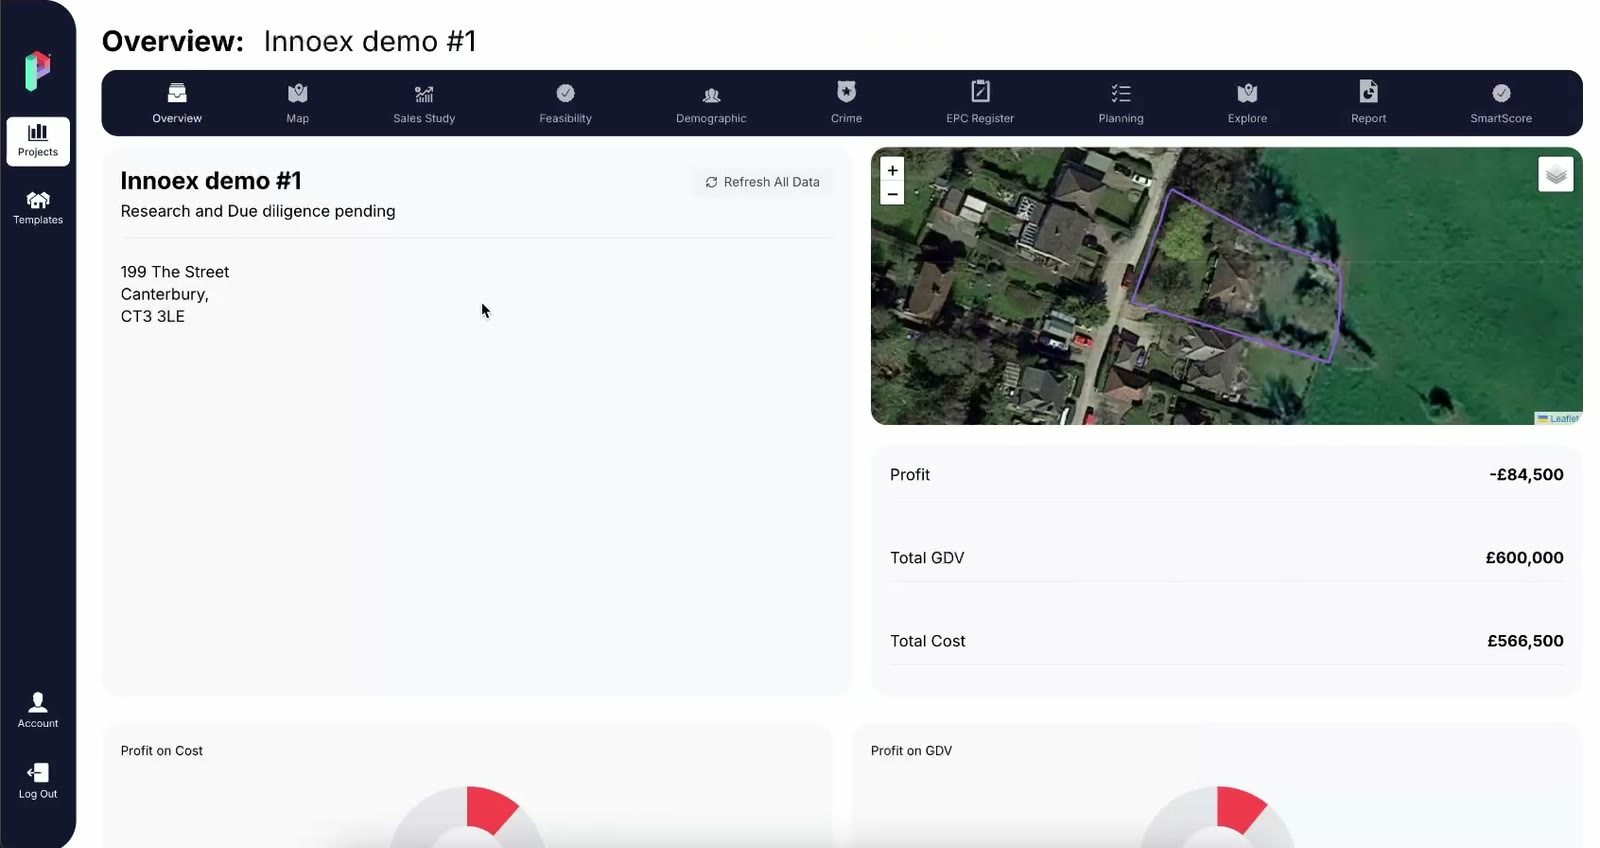
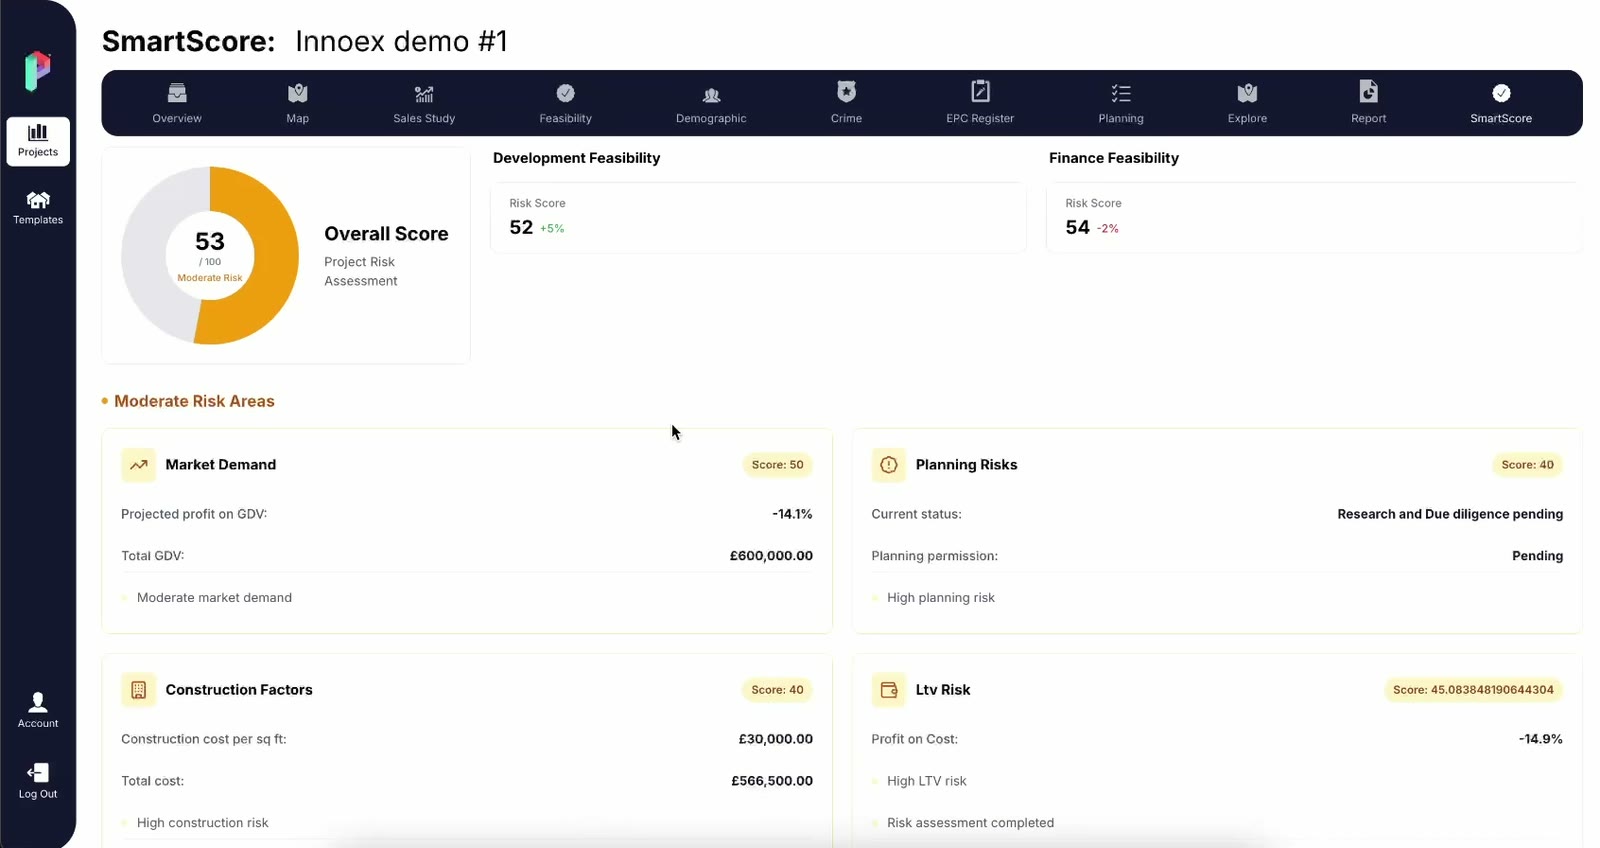
Rank a shortlist like for like
Every site is scored out of 100 on the same categories. The shortlist ranks itself, and each score shows the number driving it.
SmartScoreThe qualitative underwrite in two tabs
Social grade, age, education and commuting around the boundary, alongside a twelve-month crime rating for the area.
Demographics and crime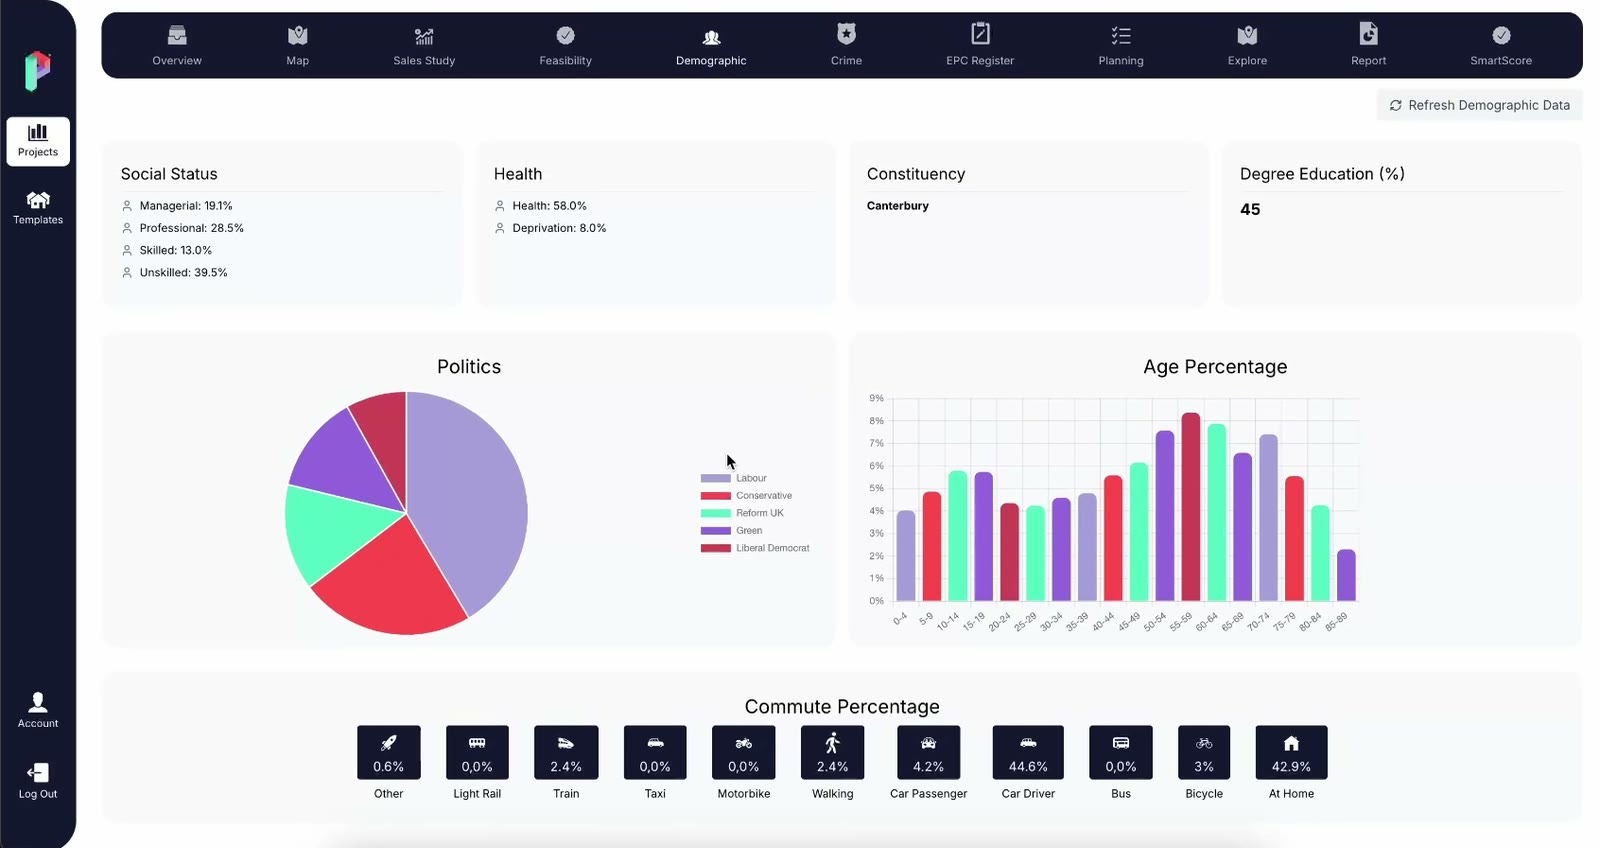
Planning precedent before you commit
What has been approved and refused nearby, and how long each decision took, while the deal is still on paper.
Planning history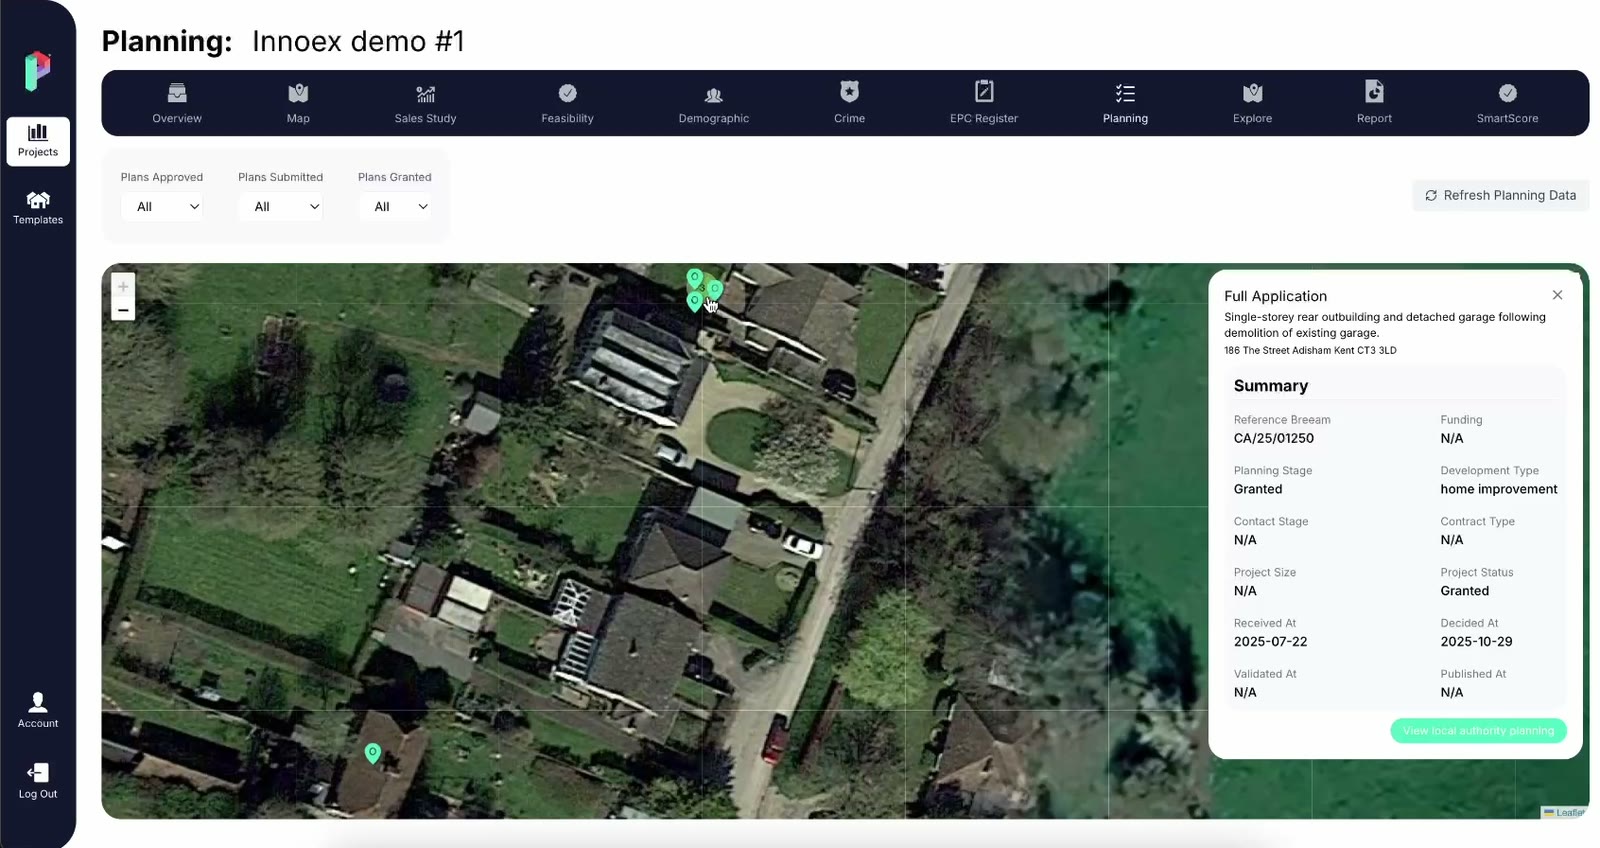
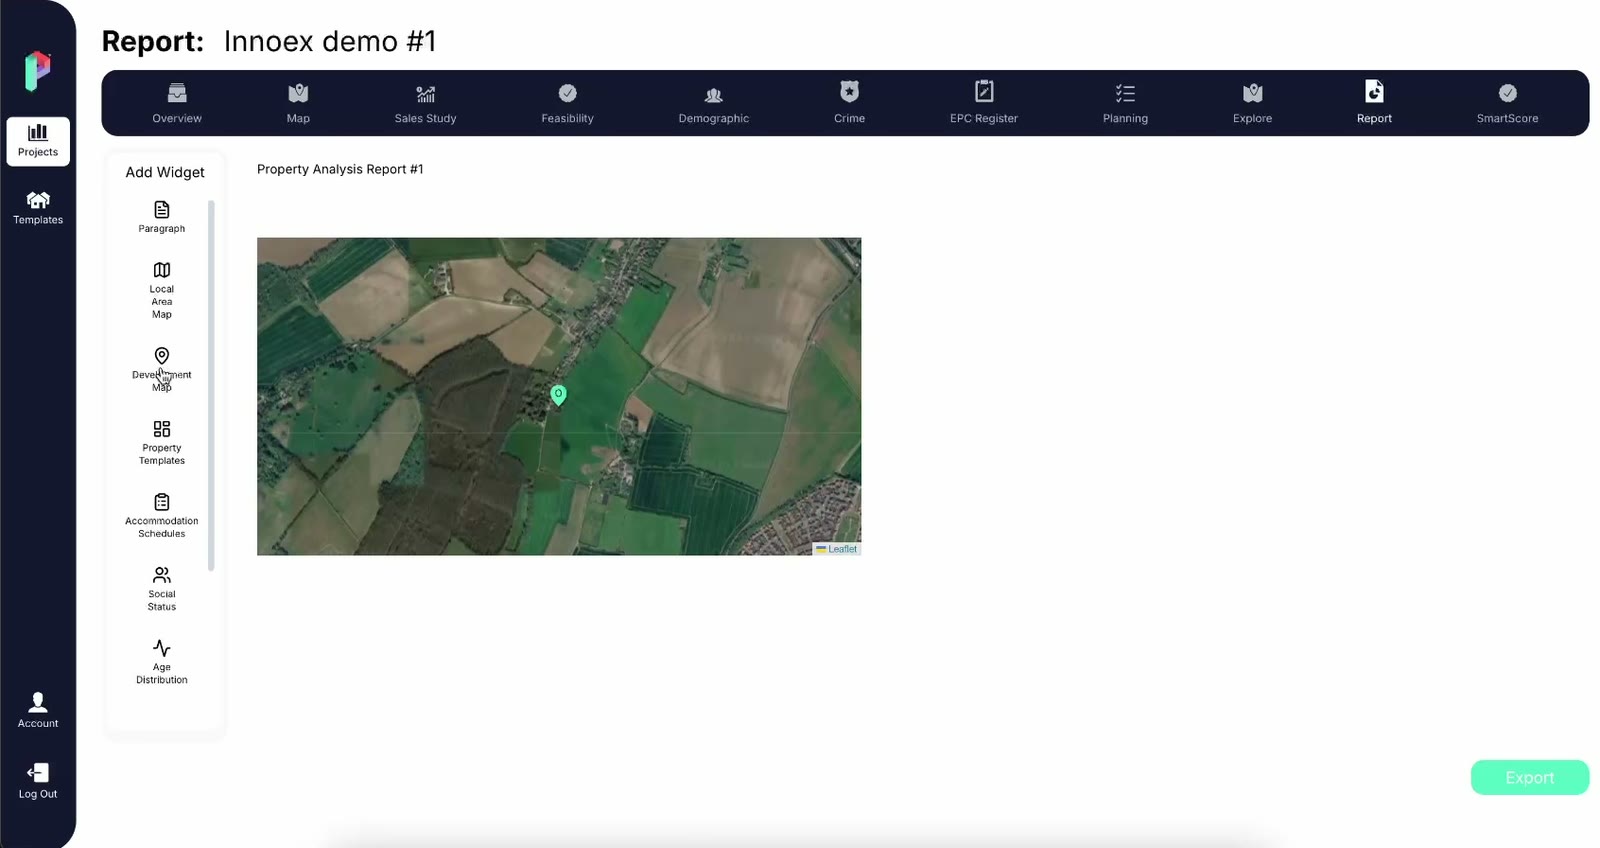
Investment committee papers from live data
Drop maps, accommodation schedules and local context into a branded report built from the project itself. The figures in the paper are the figures in the model.
Also built for
Bring a site you're looking at. We'll run it live.
Demos take twenty minutes, and there's a free six-day trial afterwards.